
National food loss and waste, measured to a number you can defend.
RUSHD compiles the Food Loss Index and the Food Waste Index under SDG 12.3 from primary field data, through a methodology proven across two national baseline programmes. Every figure we publish traces back to a weighed, photographed, geolocated record.
The number most countries do not have
Close to a third of the world's food never reaches a plate. FAO estimates that 13.3 percent is lost between harvest and retail, and UNEP measured a further 1.05 billion tonnes wasted in 2022 across households, food service and retail. The bill exceeds USD 1 trillion a year, food that is never eaten drives 8 to 10 percent of global greenhouse gas emissions, and households discard over a billion meals a day while 733 million people face hunger.
Yet the figures most governments hold are borrowed. Coefficients get imported from other regions, model outputs are mistaken for measurement, and single studies are stretched far past their design. Responsibility fragments across agriculture, statistics, municipal and environment bodies, each holding one piece of the picture, and because methods change between studies, nobody can say whether a movement in the figures is progress or noise.
This is why rates have barely shifted since 2015. Halving food loss and waste by 2030, the target set under SDG 12.3, begins with a number a country can stand behind. Producing that number is what our practice was built to do.
Six stages, from first alignment to a capability you keep
Our delivery model sequences seventeen method components across six gated stages, each closing against fixed criteria before the next opens.

The RUSHD FLW Methodology
Our proprietary delivery model, engineered so every published figure traces to a weighed, verified field record.
UN SDG Target 12.3
Halve global food loss and waste by 2030, the target every figure reports against.
FAO Food Loss Index
The FLI method for measuring loss from harvest to retail.

UNEP Food Waste Index
The FWI method for measuring waste at retail and consumption.

FLW Accounting & Reporting Standard
The FLW Protocol standard, convened by the World Resources Institute.
Align
Governance, decision rights and the national data foundation come first. We map the food system actor by actor, formal and informal, and sequence stakeholder engagement so access is secured before field timelines tighten.
Design
Boundaries are fixed before any data is collected: value chain stages, commodity basket, geography, destinations and reporting year. Stratified sampling and per-actor measurement methods are agreed with the national statistics authority.
Mobilize
Field agents are trained, tested and certified before they collect a single record. Participants are recruited to quota with consent captured up front, and routes, calibrated equipment and contingency plans are locked ahead of launch.
Measure
Certified teams weigh, photograph and geolocate every observation through our field application, and a supervisor reviews each record before acceptance. Coverage is monitored live, so gaps are corrected while the field is still open.
Report
Preliminary findings face structured challenge from sector and institutional reviewers before any figure is locked. Validated evidence then becomes the national baseline report and index outputs in FAO and UNEP custodian formats.
Institutionalize
The programme closes by transferring the method: trained counterparts, handover toolkits, frozen definitions and a documented pathway, so the next measurement cycle can run without us.
Measure. Monitor. Mitigate.
Three Ms, one promise: the taste of good food lasts, and it stays affordable, accessible and safe.
Three services run on one data spine. Measurement builds the evidence, monitoring keeps it current, and mitigation acts on it, with every intervention tracked against the same baseline it came from. Engage the full arc or start where your need is sharpest.
Measure
A baseline study that establishes how much is lost and wasted, where in the chain, and what it is worth. Scoped to a nation, a region or a single entity, with both SDG 12.3 indices compiled under FAO and UNEP methods where the mandate requires them.
Monitor
Standing visibility in place of a one-off study: live dashboards of loss and waste rates by stage, region and commodity, with repeat cycles on a fixed comparable base so movement in the figures is real progress. Outputs feed SDG and ESG disclosure directly.
Mitigate
Advisory that converts measured evidence into reduction: intervention portfolios ranked by impact and feasibility, behavioural programmes built on measured drivers rather than assumptions, and policy support for governments acting on their baseline.
Built for every side of the food system
The same data spine serves three kinds of mandate. Choose the door that matches yours.
Public sector
- National FLW baselines: the Food Loss Index and Food Waste Index compiled from primary field data
- National FLW reduction strategies with targets, governance and delivery architecture
- Implementation of national strategic programs and initiatives, embedded with your teams
- SDG 12.3 and international reporting in FAO and UNEP custodian formats
Private sector
- Entity and site baselines that price your loss and waste in riyals, not estimates
- Measurement across production, distribution, retail and food service
- Standing monitoring with live dashboards, repeat cycles and ESG disclosure feeds
- Mitigation portfolios that cut cost and carbon where the data says it pays
Non-profit sector
- Awareness building and behavioural campaigns grounded in measured drivers
- System improvements for food banks, redistribution and rescue operations
- Programme design and impact measurement that donors and boards can audit
- Coalitions and partnerships that connect surplus food to need
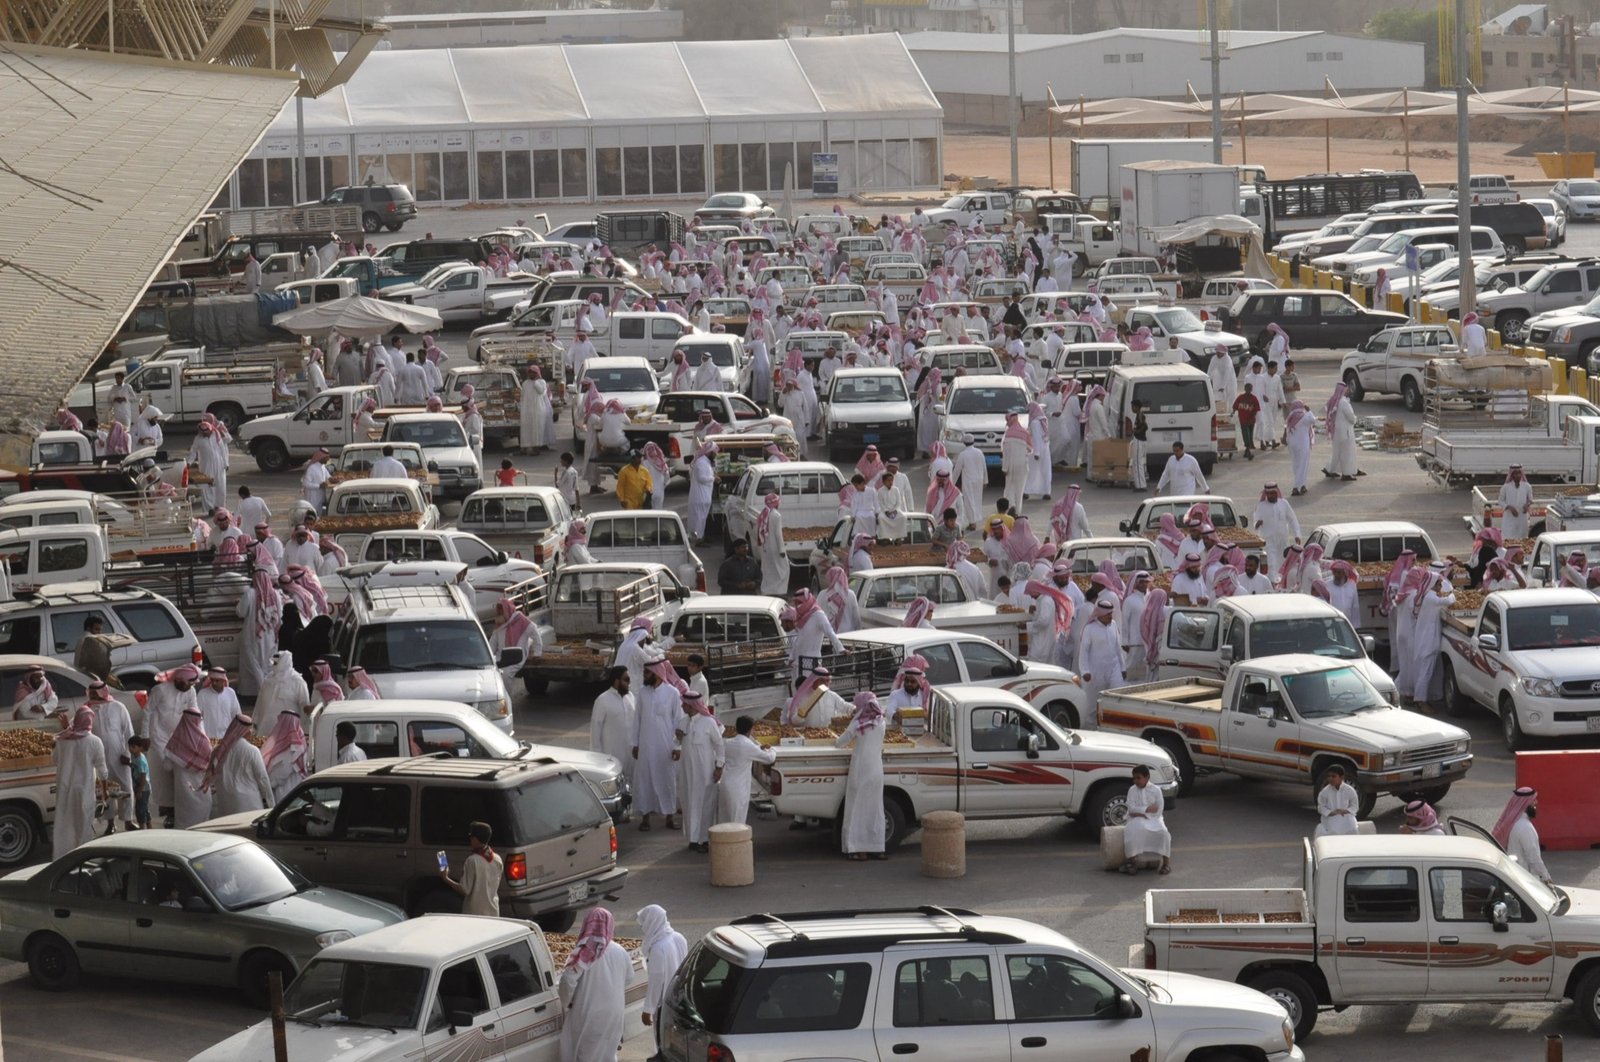
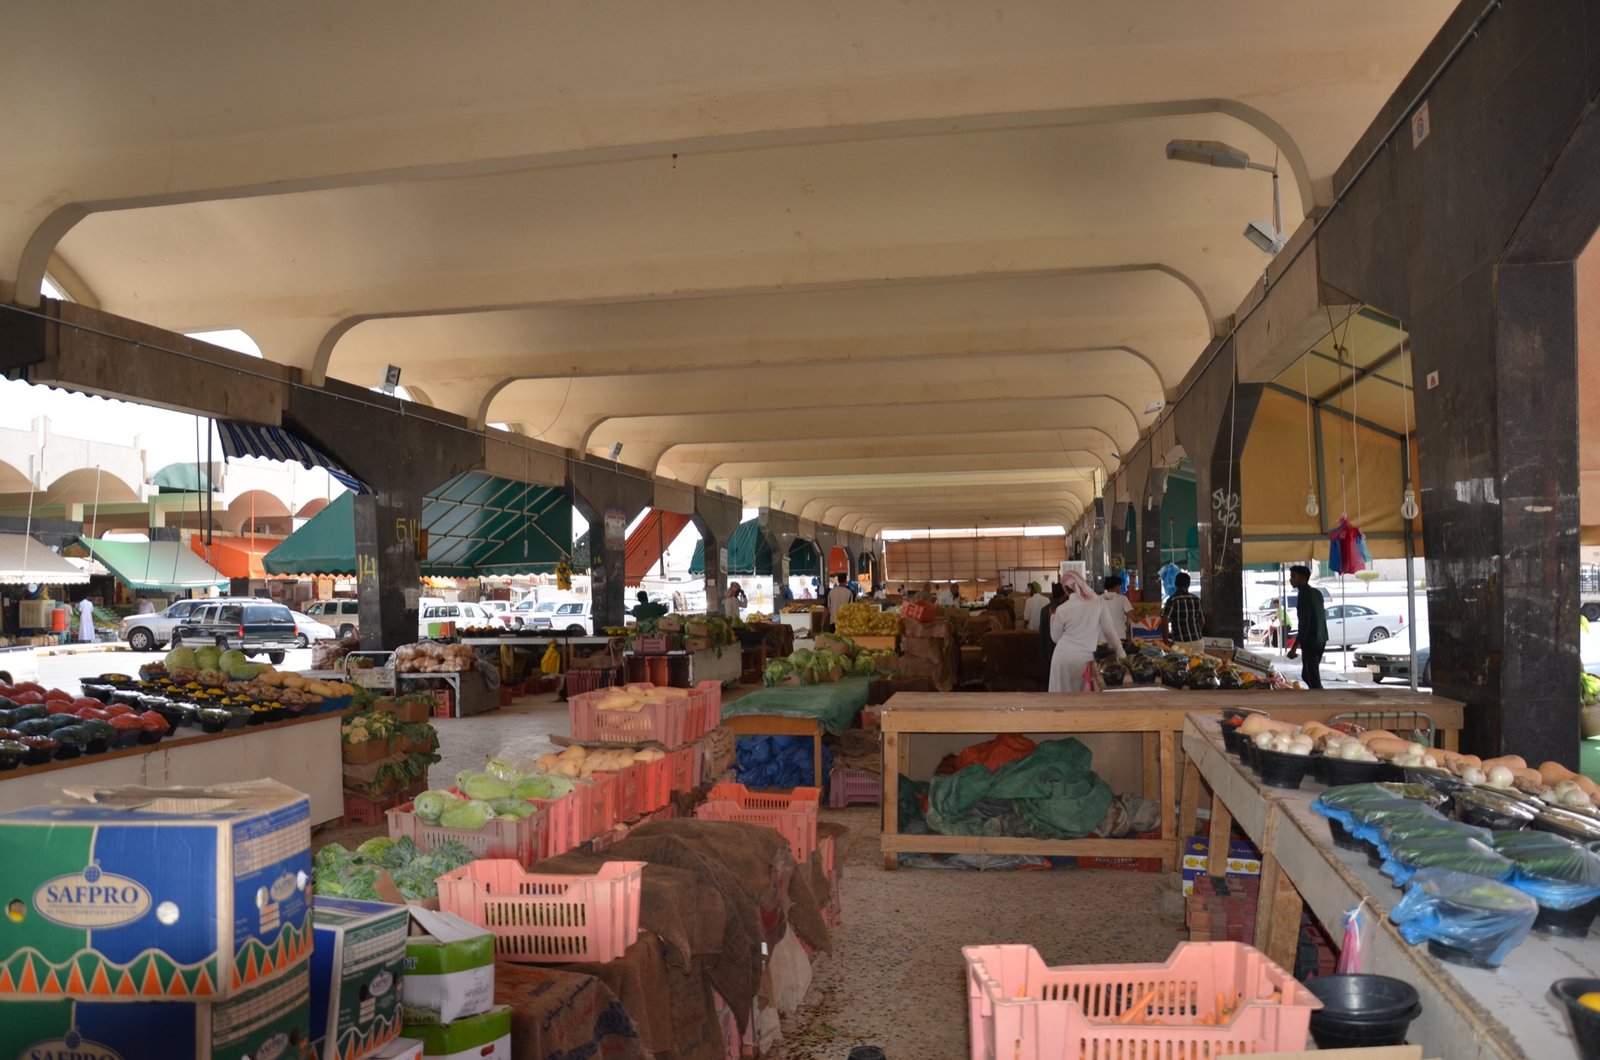
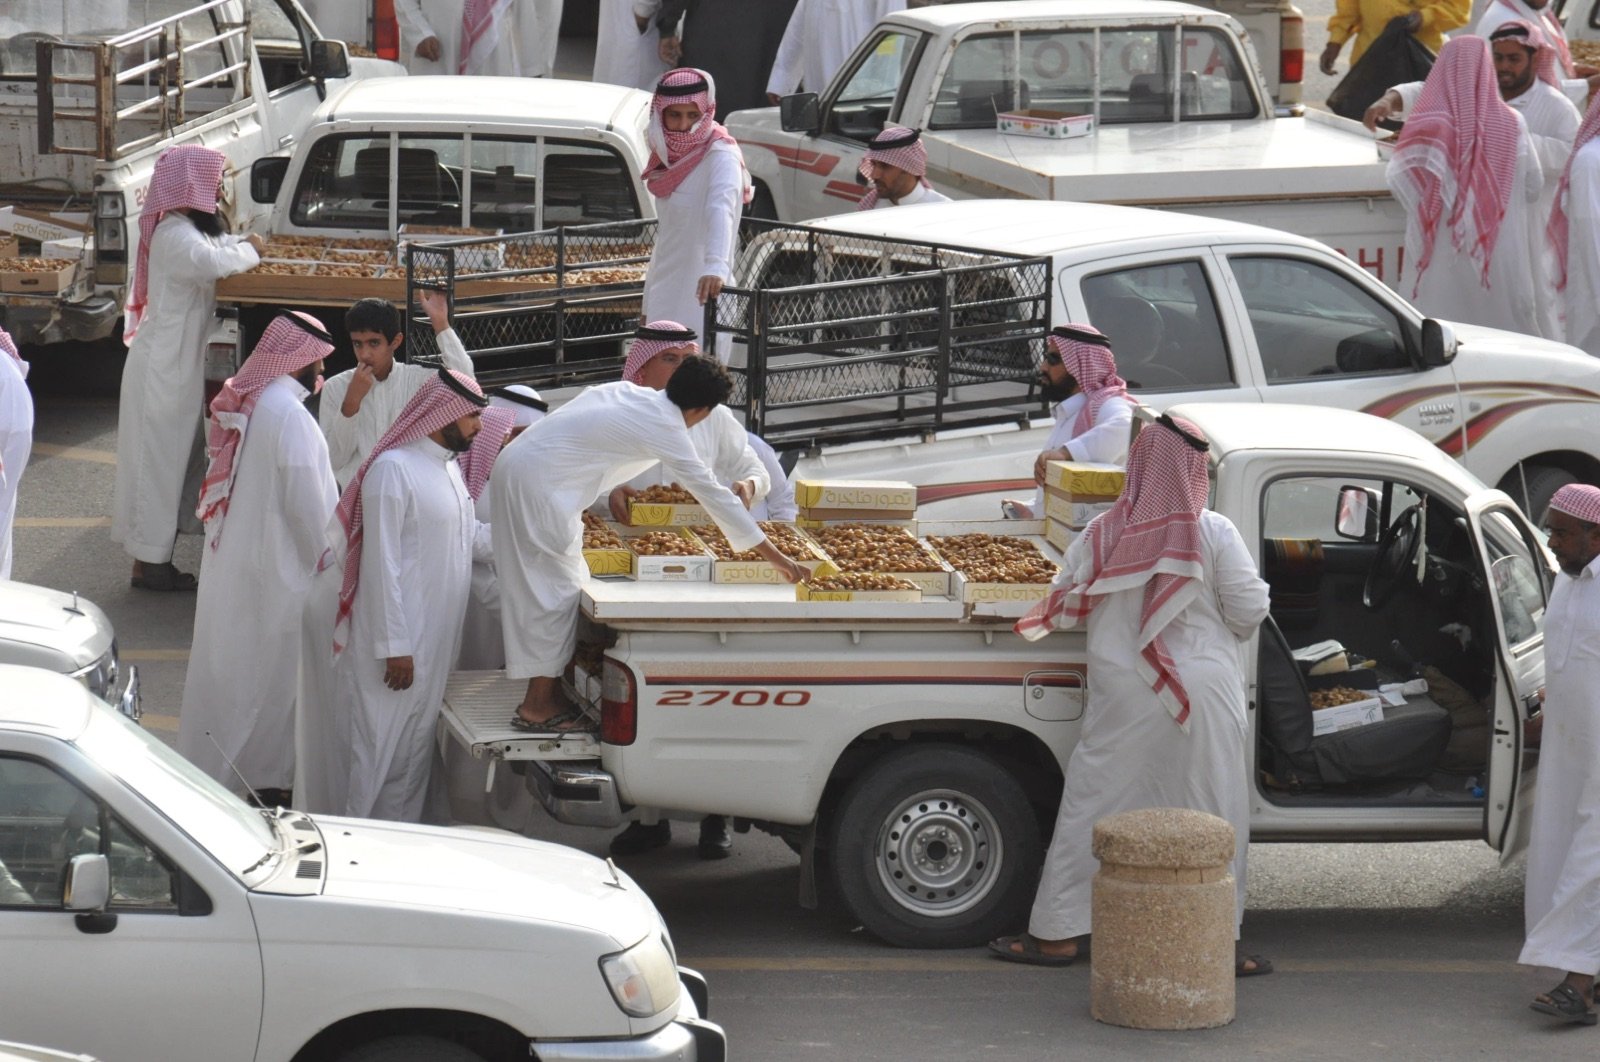
Buraidah date market, Qassim. A single market can move a harvest in a morning; a national number has to hold at that scale.
Why our numbers hold
Measurement, not modelling
Direct measurement of representative samples is our default. Models, proxies and borrowed coefficients appear only as documented exceptions, never as the base of a headline figure.
A chain of custody you can audit
Every submission is geofenced, time-stamped, photo-backed and supervisor-reviewed before acceptance, and published adjustment logs and reliability grades show exactly how each number was made. A national figure can be traced to a single weighing.
Standards built in, not bolted on
FAO and UNEP index methods and the FLW Standard's five accounting principles shape governance, sampling and computation from day one, rather than being referenced in the final report.
Our own field force and platform
Trained, certified and identity-verifiable agents, calibrated weighing equipment, and a purpose-built data system that carries every record from a market stall to a national dashboard.
Start with the number.
Reduction starts with a measured number and survives on a monitored one. Whether you are a government preparing SDG 12.3 reporting, a food business sizing a cost you are already paying, or an institution funding food security work, the first step is the same. Talk to us about your mandate, your geography and the fastest credible route to your baseline.